Science at CRCCS Term 1
Year 7 Science
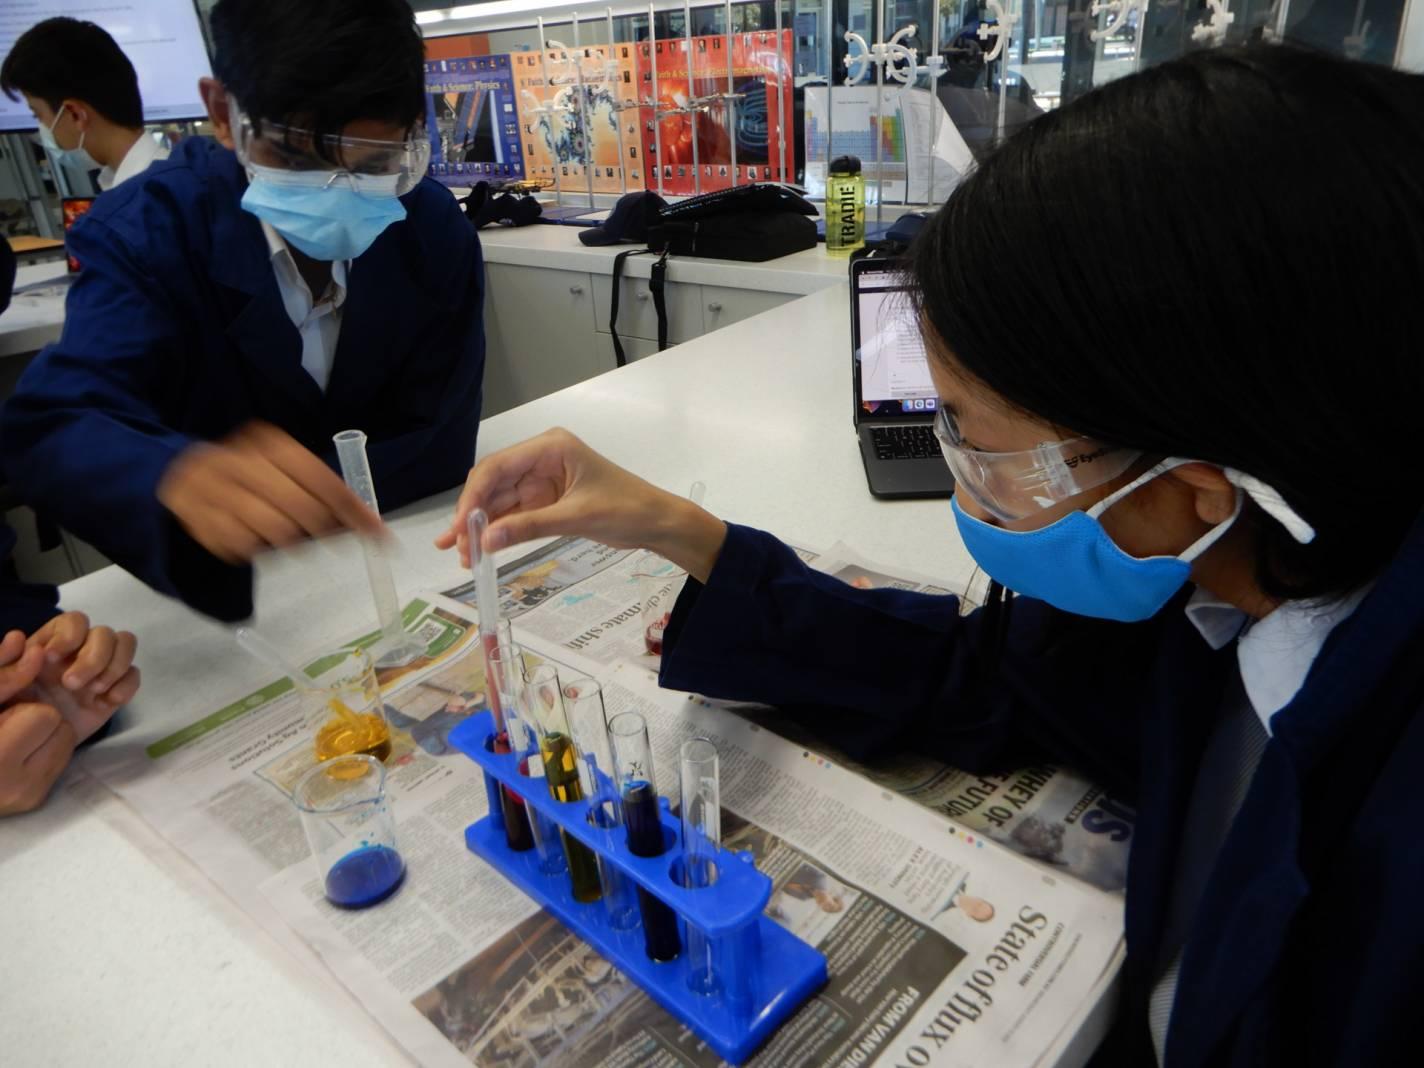
Year 7 students are exploring the introduction to science, in particular learning how to accurately measure/observe results. Students studied the difference between quantitative and qualitative measurements and through the practical of measuring different coloured solutions, observe and understand the meniscus curve and how can result in errors when measuring.
Year 9 Forensics Science
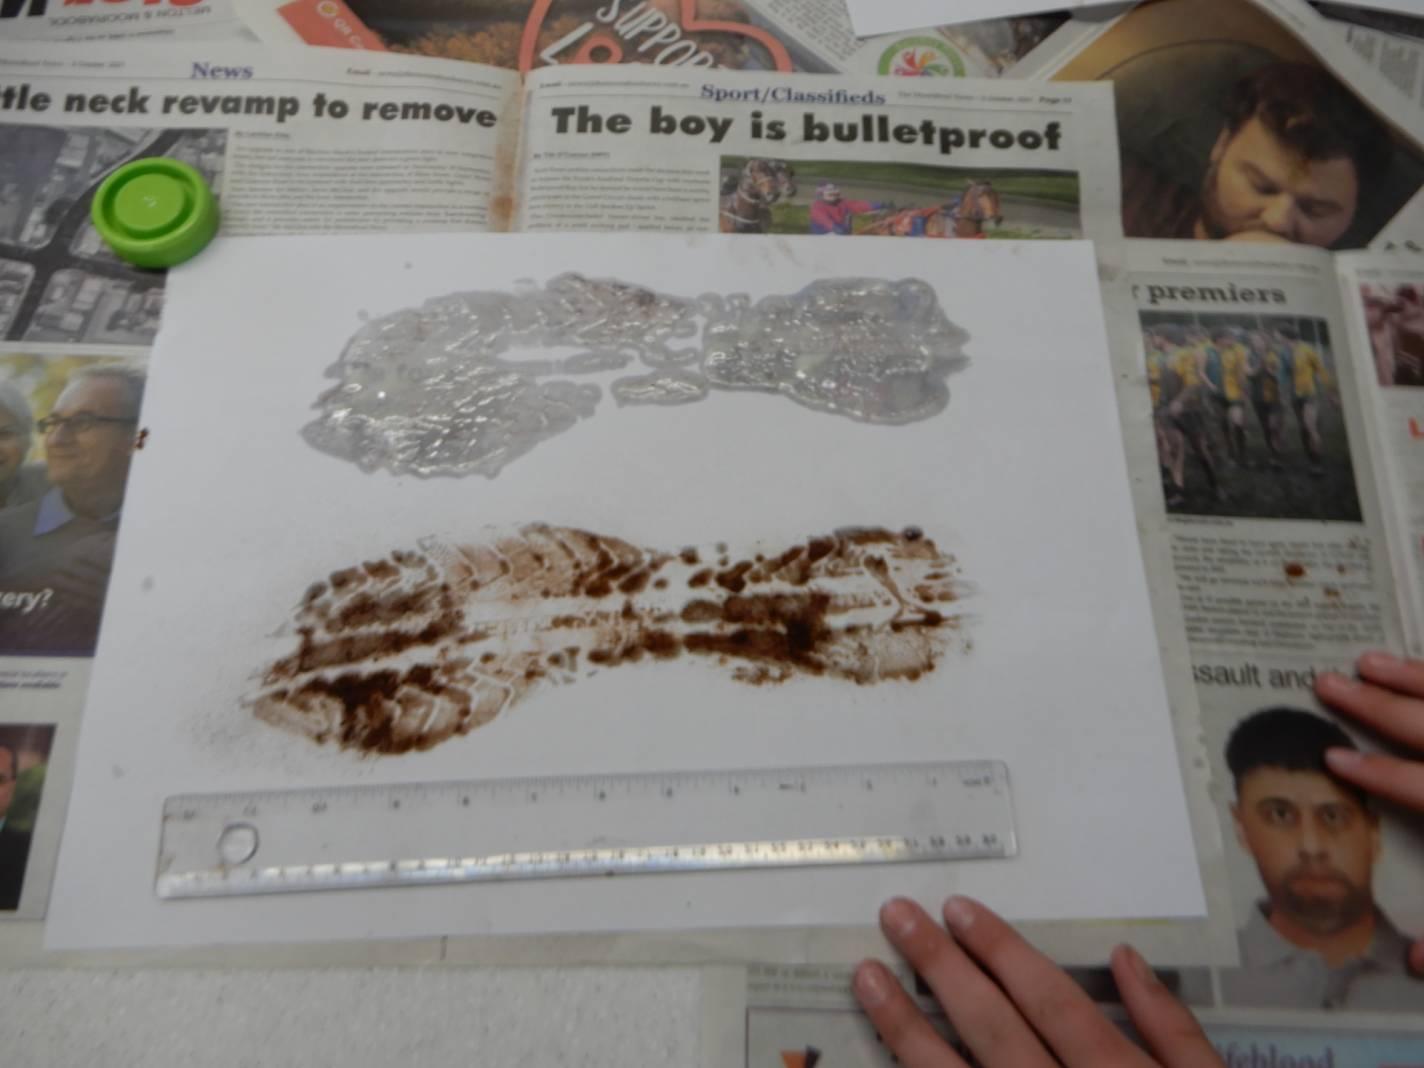
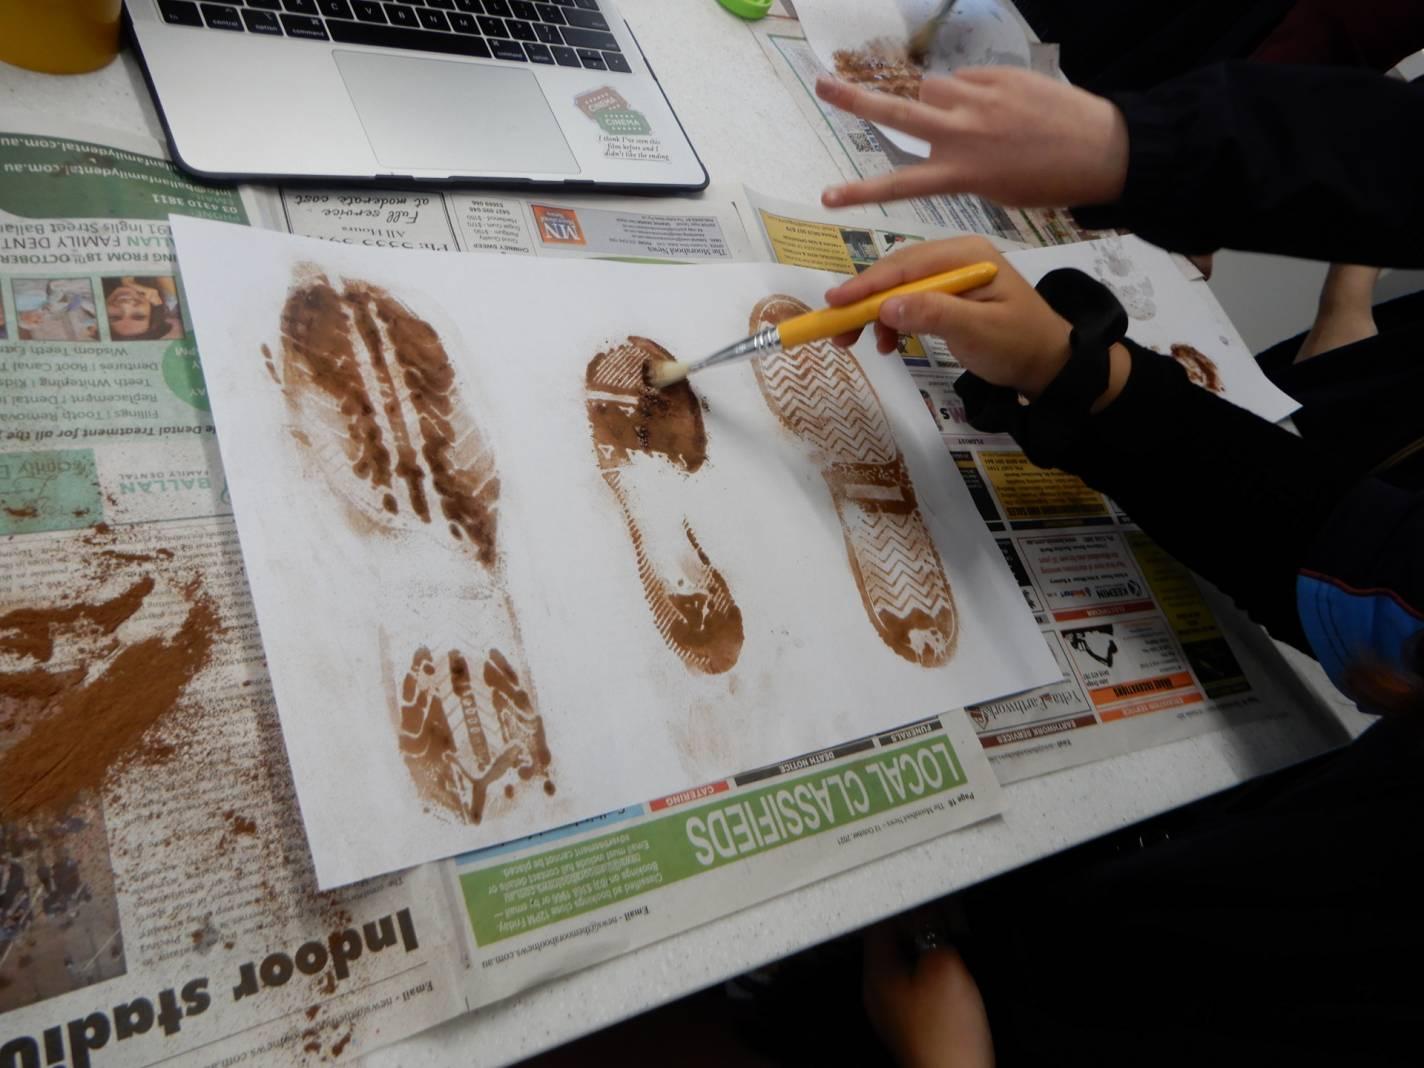
Year 9 Forensics Science students are learning about being able to identify surfaces that can create impressions from the contact of a suspect. The practical conducted was ‘Footwear impressions’ where students were invited to
- Display impressions in different materials of different textures
- Make a simple impression of a unique body part
- Derive ways to further analyse the impression in the Forensic Laboratory
Year 10 Biology
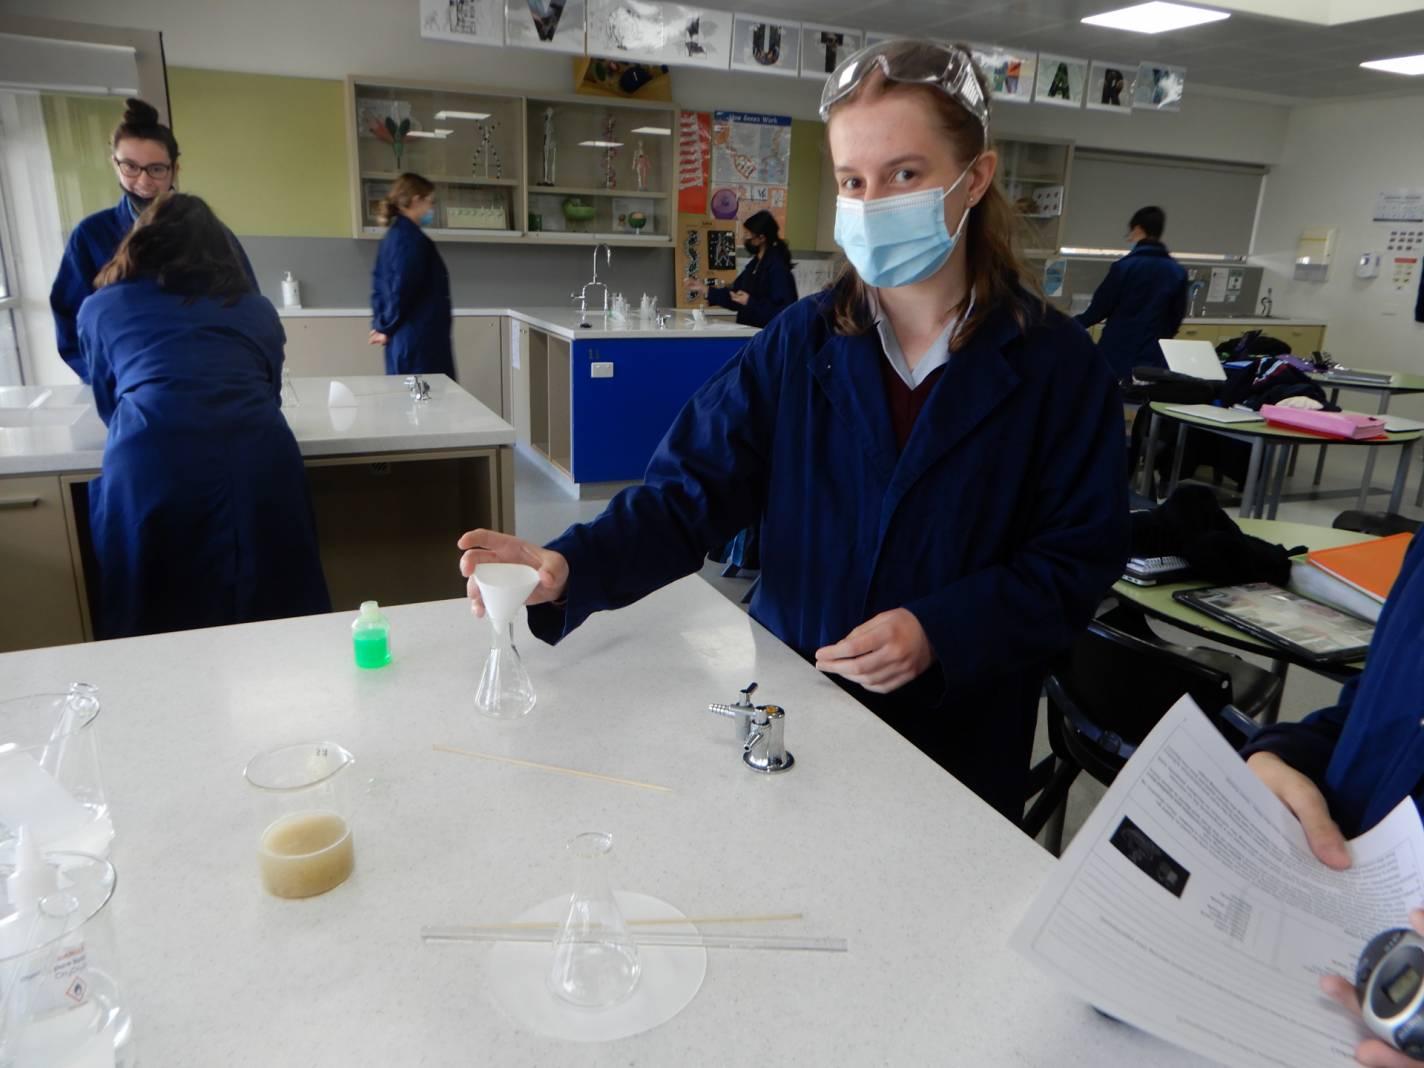
Students learnt the processes involved in extraction DNA from cells. They had the opportunity to understand the process for extracting DNA from a Kiwi Fruit successfully.
Year 10 Chemistry
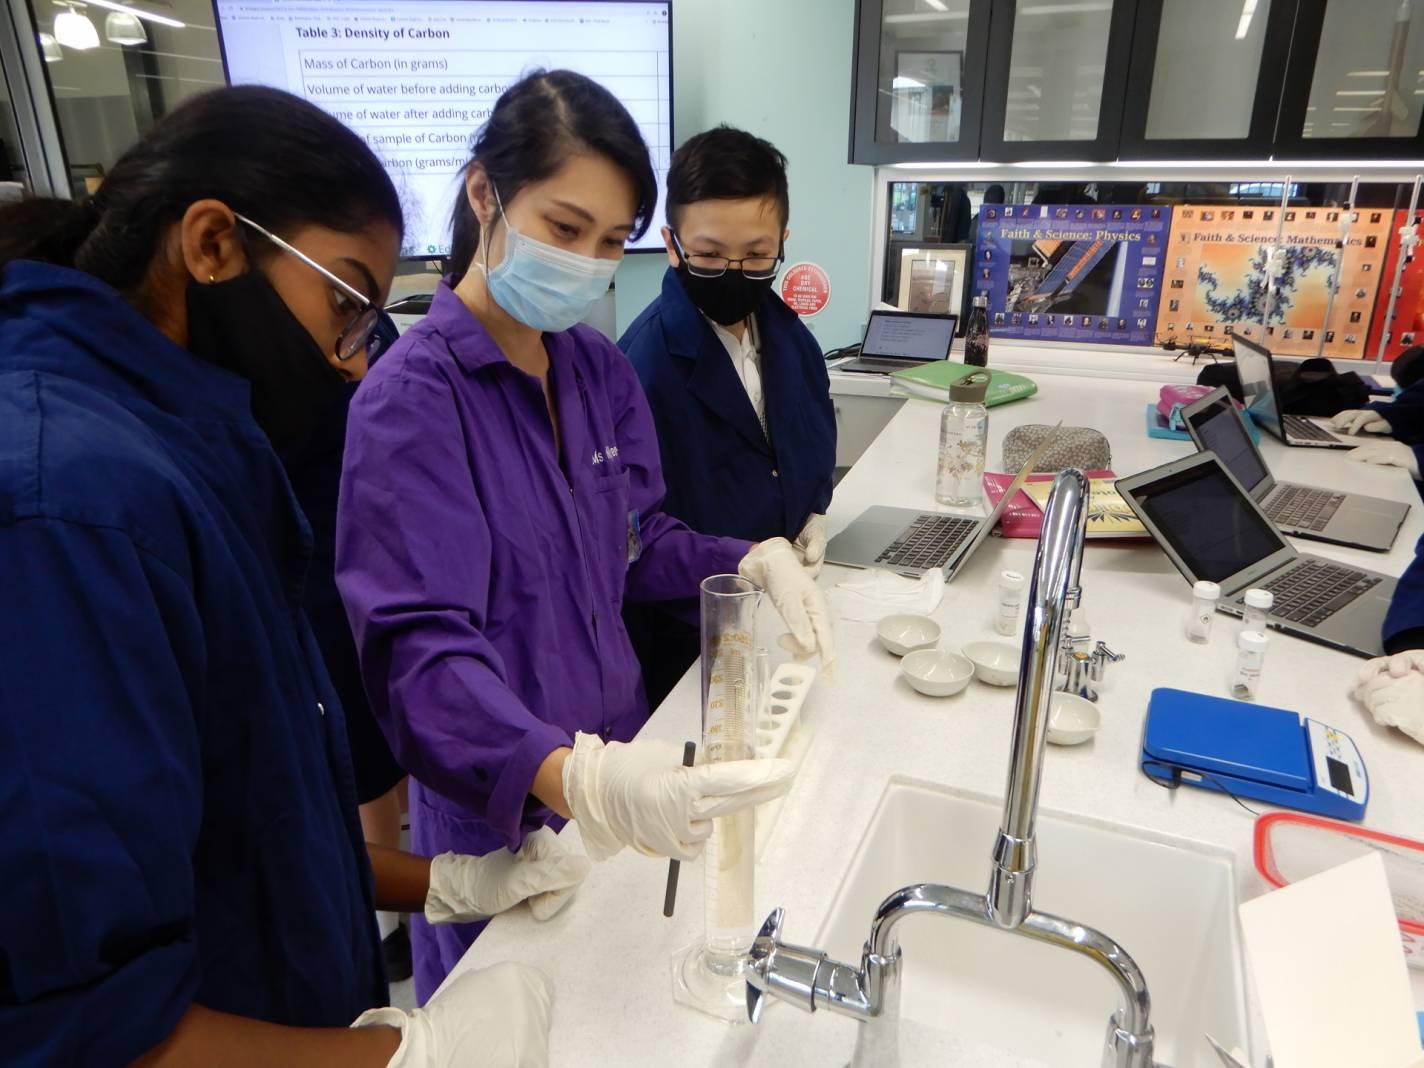
Year 10 Chemistry students identified the trends in metal reactivity within different groups when put in water and acid. The students in the practical were invited to calculate the density of an element and recognise the trend in density in a group.
Year 11 VCE Biology
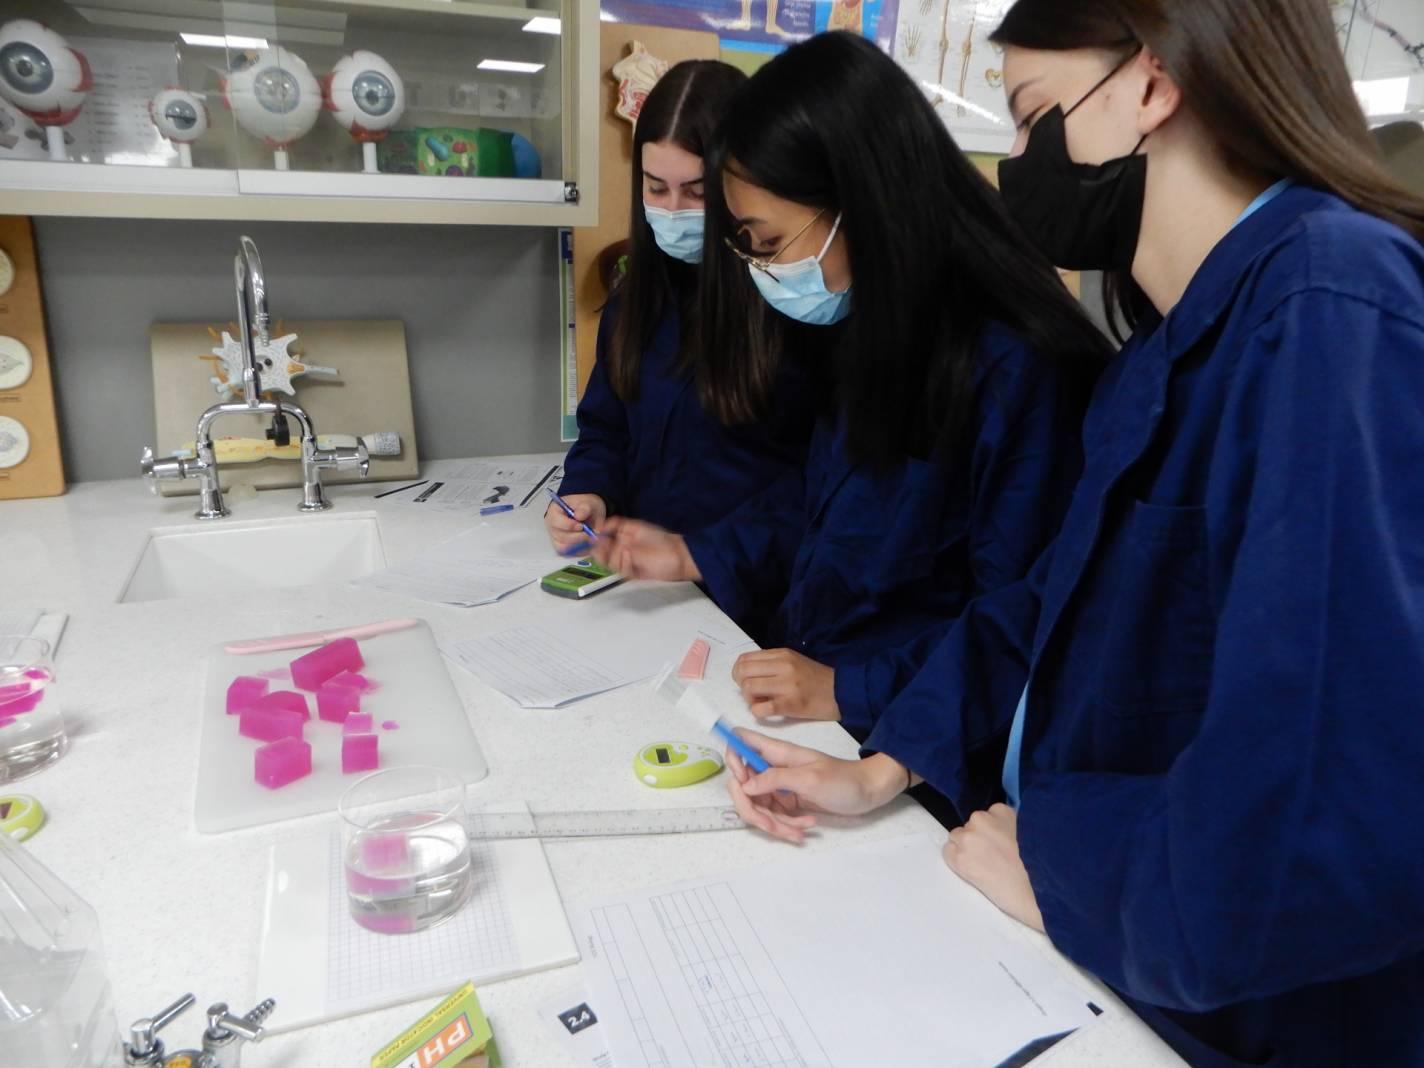
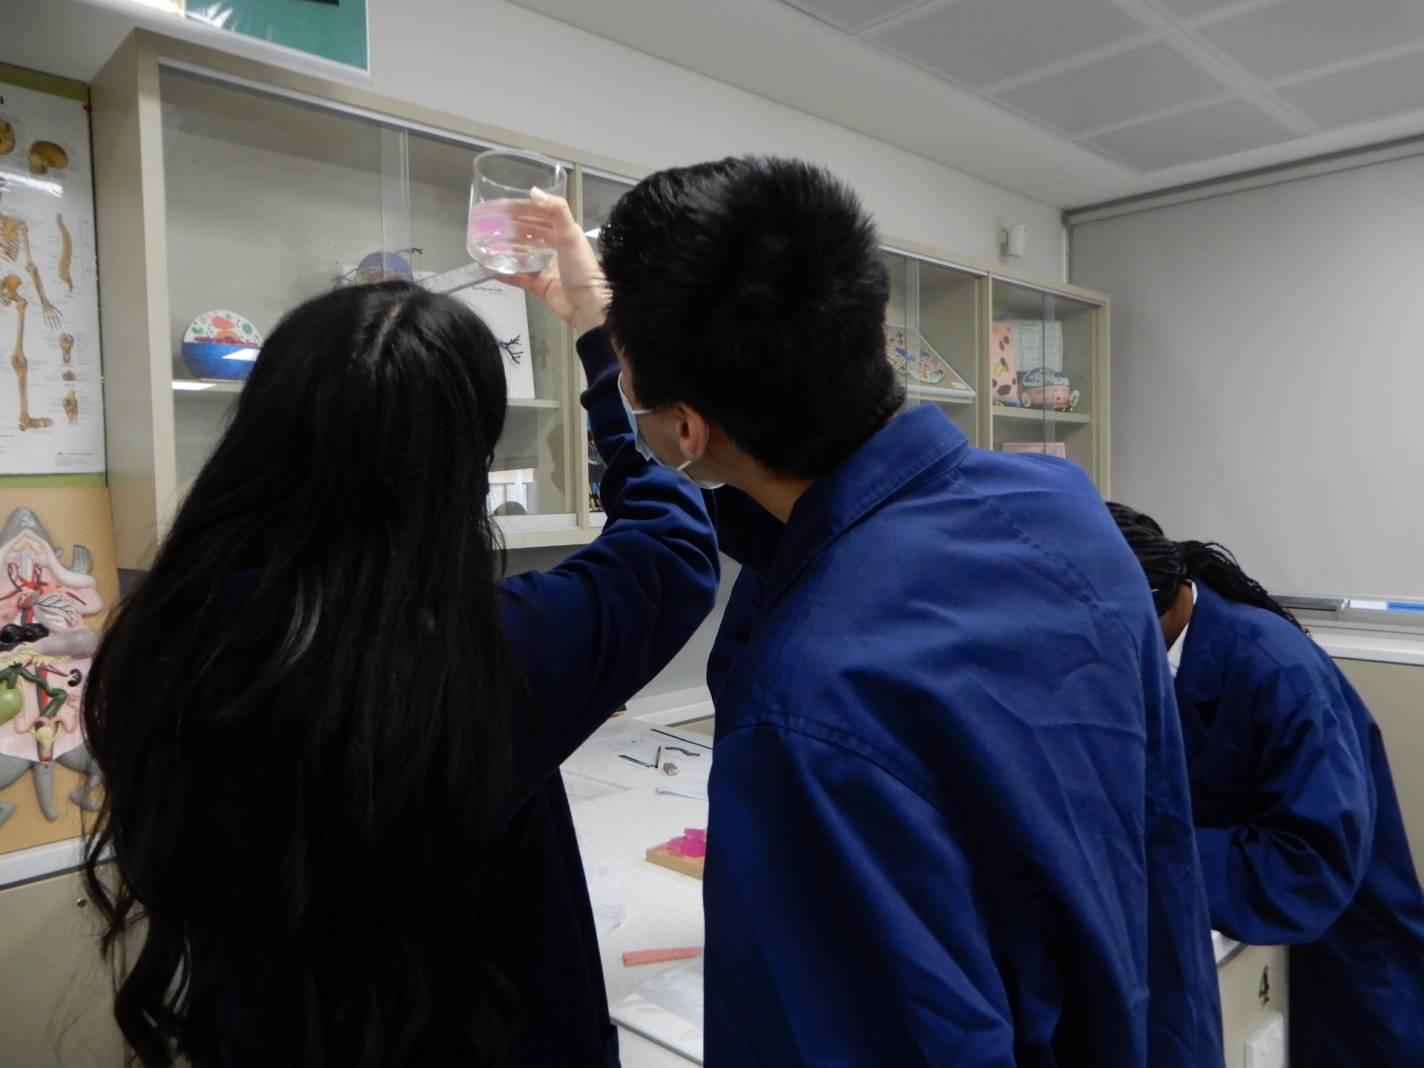
Year 11 VCE Biology students commenced their Unit 1: How do organisms regulate their functions? Their first focus was exploring how the cells function. Students gathered the understanding that organelles are needed for specific cellular functions. They were able to use agar jelly to observe the surface area to volume ratio limits cell size through the process of diffusion.
Everyday Science
Students explored the steps in Scientific Research, focusing on gathering and understanding data collected. In conducting the practicals, students were able to test the effect of an independent variable on the spurt height of soft drink with Mentos added to it. They also exported the collected data into an appropriate graph and evaluated this data.


